—
Assessment of development on labor market in 2009 and the outlook for 2010
The development on labor market reacted with delay, but anyway very appreciably on the progress of economic recession. Similarly, as the parameters of labor market worsened with delay (after development of production), they will probably improve the same way with delay. This fact has negative impact on incomes of social security funds, including health insurance companies.
Decline in employment in SR will belong to those more dramatic within EU
Government officials repeatedly tried to convince the public, that thanks to their policy the impact of crisis on Slovak society is milder than in other economies. The main goal of anti-crisis policy of government was preserving the employment. And right on the example of employment we can prove the untrueness of statements about better handling of recession in SR compared to other countries. Figure 1 reflects year-to-year changes in employment by quarters and it results from it, that:
- The progress of employment was in most of the cases worsening from quarter to quarter. It is true for most developed European states (former EU 15) as also for majority of new members – former socialist economies. But in SR is the worsening in development of employment in third quarter (compared to former quarters) especially obvious.
- Year-to-year decline of employment in SR in third quarter was more significant than the average of EU 15 and also EU 27. Less favorable figures (significantly!) were recorded in Baltic economies. So the impact of recession on employment in SR was compared to most of economies milder only in the first quarter of 2009, in the third quarter it was reversed. Argumentation of government will stand only compared to Baltic countries.
In the development of the structure of employment we consider important, that there was showed the advantage of higher level of education. While in the third quarter of 2009 dropped the total number of workers by about 106 thousand persons, the number of workers with university degree in the same period raised by about 14,7 thousand persons. (for this effect see also Morvay, K.: Before next macroeconomic stabilisation (3), IntoBalance December 2009).
Figure 1: Year-to-year change of number of workers in three quarters of 2009 (in %)
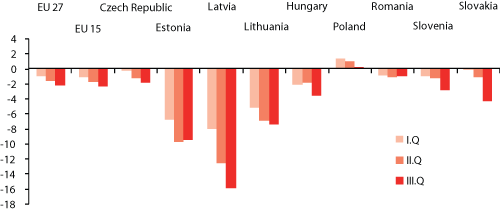
Source: Eurostat
Rate of unemployment grows substantionally, but it remembers also worse times
We can see the delay of negative effects on the labor market after the start of recession very well in Figure 2. The rate of unemployment by sample survey of labor force (SSLF) in the last quarter of 2008 even plummeted in accordance with long-term trend regardless of complication in development of production. Even in the first quarter of 2009 the rate of unemployment didn’t increase (although real GDP declined by 5,6%), there was only a disruption of tendency of its decline. There was a rapid deterioration only in the third quarter, when the rate of unemployment increased year-to-year by 3,5 percentage point. Even the average rate of unemployment by sample survey went close to 12% (there is still missing the number from the last quarter), it still doesn’t attain the values from period 2001 – 2002 (18,5% to 19,2% – and there was no global recession), which represent up to now recorded maximum.
From data about registered unemployment (those are available till the end of the year) we can read the halt of opening of scissors between the rate of unemployment in years 2009 and 2008. In Figure 3 there is a significant widening of this scissors from 0,9 percentage point in January up to 5,0 percenatage point in September and subsequent halt of widening, even slight narrowing.
Figure 2: The rate of unemployment by sample survey of labor force in quarters of 2008 and 2009 (in %)
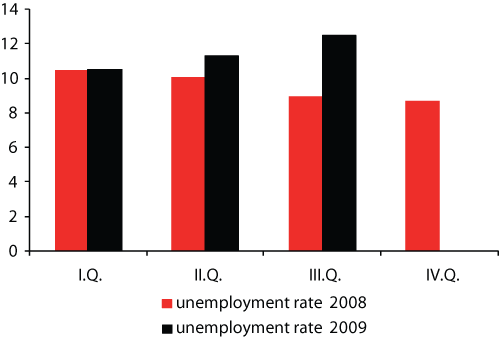
Note: methodology of sample survey of labor force (SSLF)
Source: Statistical office of SR, Slovstat database
Figure 3: The rate of registered unemployment by months in years 2007 to 2009 (in %)
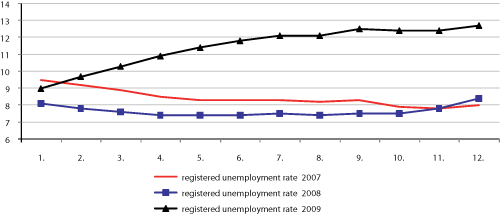
Source: Statistical office of SR
Favorable signal: regenerated flows in registers
Headquarters of labor, social affairs and family publishes monthly data about inflows and outflows of applicants for job. It is probably a good sign, that after radically lowered outflow of applicants from register in first part of 2009 was gradually coming to its strenghtening (we compare here the value with the same period of previous year). In Figure 4 we see the growth of inflow of applicants and substantional lowering of their outflow (compared to same period of 2008) in the beginning of 2009. Later we see the recovery of outflow accompanied by still strong inflow (in Figure 4 data from June, September). At the end of the year (see the number from December) it is noticeable the relaxation of inflow compared to same month of previous year and raising of outflow of applicants. Flows in registers in December 2009 are more favorable than they were in December 2008. Higher dynamics of flows in registers was not enough for lowering the rate of unemployment, but it is a favorable signal about recovering of labor market. High dynamics of both categories (inflows and outflows) is the proof of ongoing restructuralization of economy (in this case so-called creative destruction), during which a lot of activities disappear, but at the same time arise or widen others.
Figure 4: Inflow and outflow of applicants for job in selected periods
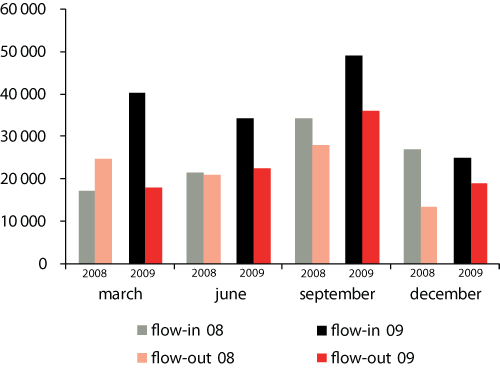
Source: Headquarters of labor, social affairs and family
The growth of wages maintained by public sector
Despite the rapid decline in rate of growth of average nominal wage (to so far undoubtedly lowest value in Slovak history), the growth of real wage remains preserved. The reason is historically lowest rate of inflation in SR.
Public sector in 2009 acted as a stabilisator of growth of average nominal wage. While in most branches the average nominal wage in year-to-year period stagnated, it was raising in branches with dominance of public sector (e.g. in third quarter by 4,2% in public sector and defence, by 6,8% in education and by 5,6% in health care and social help). Such a position of „main source of growth in wages“ will public sector not be able to afford.
Figure 5: Development of average nominal and real wage (index, same period of previous year = 100)

Source: Statistical office of SR, database of Slovstat
|
|
2008 reality |
2009 estimation |
2010 prognosis |
|---|---|---|---|
| Year-to-year change in employment in % (SSLF) |
3.2 |
-2.5 |
-0.5 – 0.0 |
| Rate of unemployment by SSLF in % |
9.6 |
11.8 |
12.2 – 12.9 |
| Year-to-year change in average nominal wage in % |
8.1 |
3.1 |
3.2 – 3.6 |
| Year-to-year change in real wage in % |
3.3 |
1.4 |
0.8 – 1.4 |
Source: Statistical office of SR (data of 2008), Health Policy Institute (estimations and prognosis)
Outlook for year 2010: Transition through bottom
We expect, that while indicators of production attained the bottom (concerning the actual recession) even in year 2009, then indicators of labor market will achieve their bottom only in first half of 2010. This bottom will not be situated markedly deeper than was the state of second half of 2009.
Even though the information about renewal of year-to-year growth in industrial production in November 2009 is familiar (which is maybe a signal about the improvement of development of production generally), in 2010 we don’t expect the achievement of critical value of growth in production necessary to raise of employment. We rather expect the alternating of bad and good news about releasing and hiring. The employers will probably have a reserve in using the labor force, which was made during the recession. They will be able to better use the partly used labor force during mild recovery and there will not arise the need of hiring of new workers. Only after spending this reserve we can calculate with more notable growth of employment and raising of dynamics of wages.