—
Paradoxes of development on labor market
Even from labor market – with big time lag – now leave some signs of recession. Right on this market they lived the longest time. The message about more than 2 percent growth in number of workers is probably the most positive and most important message about macroeconomic development in first quarter of 2011. It doesn’t mean definite and smooth turnover in development on labor market whatsoever. Information about development of unemployment are contradictory, same as the information about wages and incomes. Labor market is currently full of contradictions. We devote here the attention to two significant contradictions.
Unemployment growing and also declining
Two institutions, which measure the unemployment in Slovakia, they prepared in June hard-to-interpret mixture of information. First, Statistical Office of SR (SO SR) informed about substantial year-to-year decline in number of unemployed and also the rate of unemployment, a few days later the Headquarters of labor, social affairs and family (HLSAF) declared opposite.
Even in the past the data about unemployment by sample survey of labor force (SO SR) and by Labor offices (HLSAF) didn’t develop identically. But the discrepancy of development in first half of 2011 is too obvious.
Both methodologies say on the basis of two methodologies about something else:
- SO SR in sample survey of labor force (SSLF) presents, how many persons by their own statement don’t have a paid job. And it claims, that rate of unemployment in first quarter declined year-to-year relatively substantionally.
- Labor offices say about the thing, how many persons they have in their evidence as job applicants (and how many of them is prepared to take the job immediately). They claim, that rate of so-called registered unemployment in the first five months of 2011 slightly raises year-to-year.
These two methodologies talk about unemployment from different views, figures obtained this way don’t have to be 100% the same, but they also shouldn’t show fundamentally different tendency of progress. But in 2011 we observe almost shockingly distinct tendencies. According to methodology of HLSAF in first quarter there was year-to-year upswing of approximately 2 200 disposable registered unemployed. And in May even more than 13 000. At the same time there was a decline of unemployed approximately by about 31 500 in the first quarter according to SO SR. If it is not explainable by administrative factors in registers of Labor offices, it would evoke a suspicion of growth of abuse of evidence on Labor offices and boom of underground economy. There are more citizens registered in registers, but in anonymous questionnaire of SSLF they state, that they have a paid job. Even therefore the discrepancy among data must be explained. If the tendency from first months of 2011 would prolong to the future, the rate of registered unemployment would for sure cross the curve of unemployment by SSLF (Figure 1) and there would arise hard-to-interpret situation, when there are more unemployed registered at Labor offices, than there is the size of unemployment admitted by citizens. This situation we know from the end of nineties. After the wave of “register cleaning” from those, who misuse it, the rate of unemployment by SSLF was substantially lower than the rate of registered unemployment. Now it looks like that the rates of unemployment can one more time change their positions (see Figure 1).
Figure 1: Two rates of unemployment
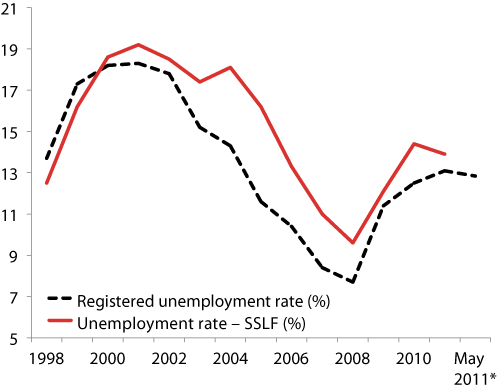
Note: of course, it is not methodically correct to mix the years, quarters and months on time axis. But here we do this because of including last – controversely acting data, * – last available datum
Source: SO SR, HLSAF
Figure 2: The rate of unemployment by both methods in first quarters of 2006 – 2011
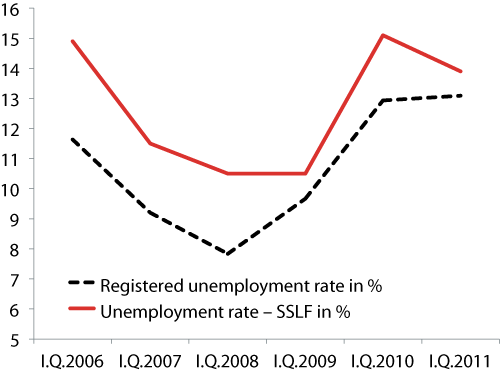
Source: SO SR, HLSAF
If we sum it up: either the culprit is the administrative impact, or something has generated sick motivation towards the registration on Labor offices. The development of real economy is better compatible with data about labor market by SSLF. Total discrepancy of results of two methodologies should not last without interpretation of makers. We will for sure return to this this theme after gaining some new information.
No methodology is immune towards distortion. Let’s admit now, that data of both institutions are alright and let’s allow the divergence of development of actual numbers about unemployment. Nevertheless is the current situation better than in the same period of previous year: in that time was the unemployment worsening by both methodologies, now is the picture at least differentiated.
But there is also an indicator of labor market, in which there is a discrepancy between SO SR and HLSAF: according to both institutions the number of vacancies has risen. Also ÚPSVaR, which reports worsening in development of unemployment in May 2011 says about growth in vacancies. In May 2010 there were 6 565 vacancies, in May 2011 even 9 078 vacancies. And so far in all months of 2011 there were a little bit more vacancies than in the same month of 2010.
Decline of real wage doesn’t mean worsening in development of incomes of households
It is an unpleasant reality, that in first quarter of 2011 there was a decline of real wage. Not dramatical, concretely it was by 0,4%. The growth of average nominal wage (2,9%) was actually lower than the growth of price level (3,3% in the same time). In the same period of previous two years the real wage slightly grows, although the outlook of development on labor market were unfavorable. In the first quarter of 2011 there was a slight upswing in the growth of nominal wages (compared to the same period of previous year), but the growth of price level has increased more significantly (Table 1).
|
I.Q./2010 |
I.Q./2011 |
|
|---|---|---|
| Rate of year-to-year growth of average nominal wage, in % |
2.1 |
2.9 |
| Rate of year-to-year growth of consumer prices, in % |
0.5 |
3.3 |
| Rate of year-to-year growth of real wage, in % |
1.6 |
0.4 |
Source: Statistical office of SR
Of course, it would be possible to find a few reasons, which would “justify” such a development, like for instance:
- It is logical, that after the end of recession the wages grow only very carefully, mainly if there is always a substantial “reserve of army of unemployed”. Historical memory of employers after recession says to be careful with hiring employees and also with setting wages.
- The growth of prices was in present progress of 2011 in a solid degree determined by outer factors. Futhermore it is still true, that the rate of growth of prices in the first half of 2011 (also with May value of 4,0%) is high only compared to previous two years. In 2009 and 2010 was the rate of inflation exceptionally low because of plunge in demand in markets, that’s why the inflation in first months of 2011 seems to be high.
If we allow for these “excusing” factors or not, the reality is that because of strenghtened inflation and because of weak growth of average wage there is an unfavorable development of real wage. The decline of real wage in first quarter was not connected with the decline of volume of incomes for the sector of households. Nominal wage grew slowly, but the number of recipients (number of employees) was growing substantionally. Moreover the wages constitute only part of incomes of households (in first quarter composed the gross wages only 40% of the whole volume of so-called common incomes of households in SR). Households receive also social welfare including pensions, incomes from property or entrepreneurship (so-called mixed incomes). Sum of all so-called common incomes of households was developing substantially more favorable than the real wage! Common incomes of households (corrected for inflation) in first quarter even plunged by 3% (although the real wage was growing that time), but in first quarter of 2011 the common incomes of households grew by 1% (despite the decline in real wage). Within the common incomes is interesting also the development of gross wages and salaries: even though the average real wage dropped slightly, total real volume of paid wages in first quarter of 2011 grew by 2,6%. In the same period of previous year the average real wage grew, but the total volume of paid wages sinked by 0,9% (Figure 3). Even more interesting is the category disposable income, which expresses that part of incomes of households, with which they freely dispose during the decionmaking about consumption and savings (disposable income is for example adjusted for compulsory payments of households towards the public administration as are taxes, deductions etc.). And disposable income in first quarter was growing while in the same period of previous year it was decreasing.
If the disposable income has grown, then its increment had to be used either for the growth of consumption, or for the growth of savings. Final consumption of households stagnated (more precisely: in first quarter 2011 was year-to-year decline in consumption by 0,1% – same as in the same period of previous year). The increment of disposable income was displayed in the growth of savings of households
Savings composed by incomes in first quarter were even by 42% higher than savings composed in the same quarter of 2010.
Figure 3: Year-to-year changes of selected categories of incomes of households (in %) in first quarters of 2010 and 2011
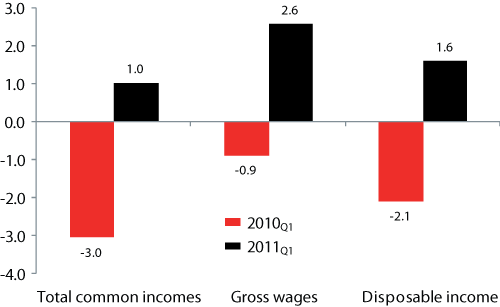
Note: Changes of all categories of incomes are adjusted for inflation, those are called real changes
Source: own calculations by the data of Statistical office of SR
Adverse development of average real wage has not demonstrably lead to plunge of incomes for sector of households. Actually, here we were talking about the total volumes of incomes of households, this statistics doesn’t say anything about income distribution (the same is true for average wage). It is not possible on the basis of these macroeconomic quantities exclude, that income situation of some categories of households was dramatically worsened. But also we cannot automatically connect the slight decline of real wage with adverse development of income situation of household sector as a whole.
The labor market has been gradually going up from the dust of leaving recession. During this going up it sometimes happens, that some parameters are improving, others are not. The picture of labor market is maybe more differentiated than in the same period of previous year, but for sure it means a favorable change.
Figure 4: Year-to-year changes of generation of savings of households (%) in first quarters of 2010 and 2011
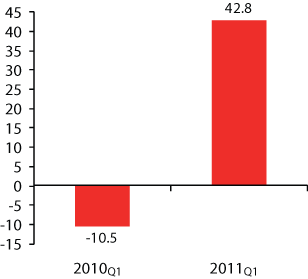
Note: Changes are adjusted for inflation, those are called real changes
Caution: Those are not changes of the total volume of accumulated savings of households. It is a year-to-year change in composing of savings in selected quarter.
Source: own calculations by the data of Statistical office of SR