—
HPI Network > HPI - Health Policy Institute > Health System in Slovakia > 3. Financing > 3.1 Health expenditure
3.1 Health expenditure
Thursday, 05. May 2011, 0:46 — HPI
| << PREVIOUS
3. Financing |
Introduction – Organization – Financing – Resources – Provision – Reforms – Assessment – Conclusions – Appendices |
NEXT >>
3.2 Sources of revenue and financial flows |
In 2009, total health expenditure as share of GDP was 7.6% according to national sources (Table 3.1). This high GDP share was rather exceptional. Before 2009, the share was around 6.5% of GDP for three consecutive years. Since 2002, total health expenditure has followed a simple rule. In the first half of the political term, it is at a lower level, followed by higher levels in the last two years of the term (see Table 3.1). The peaks in the periods 2004–2005 and 2009–2010, with expenditure significantly rising over 7%, are the result of bail-outs and year-on-year rises in private expenditure. In 2009–2010, the increase in state contributions on behalf of the economically inactive population presented an additional factor.
Table 3.1: Contribution of each financing source in € million and as % of GDP
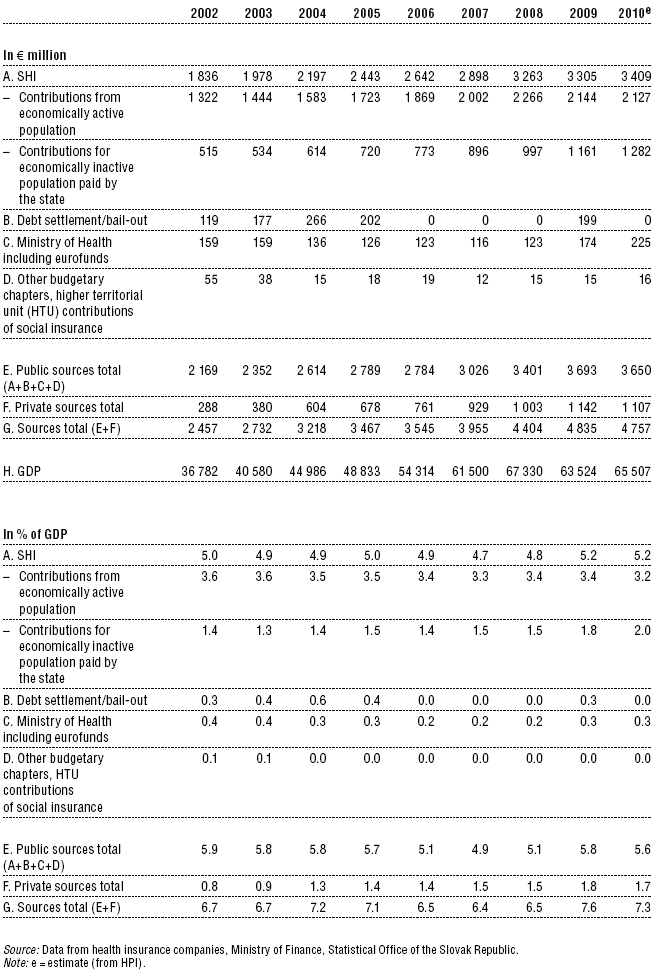
Fig. 3.1: Total expenditure on health as a share (%) of GDP in the WHO European Region, 2008 (WHO estimates)
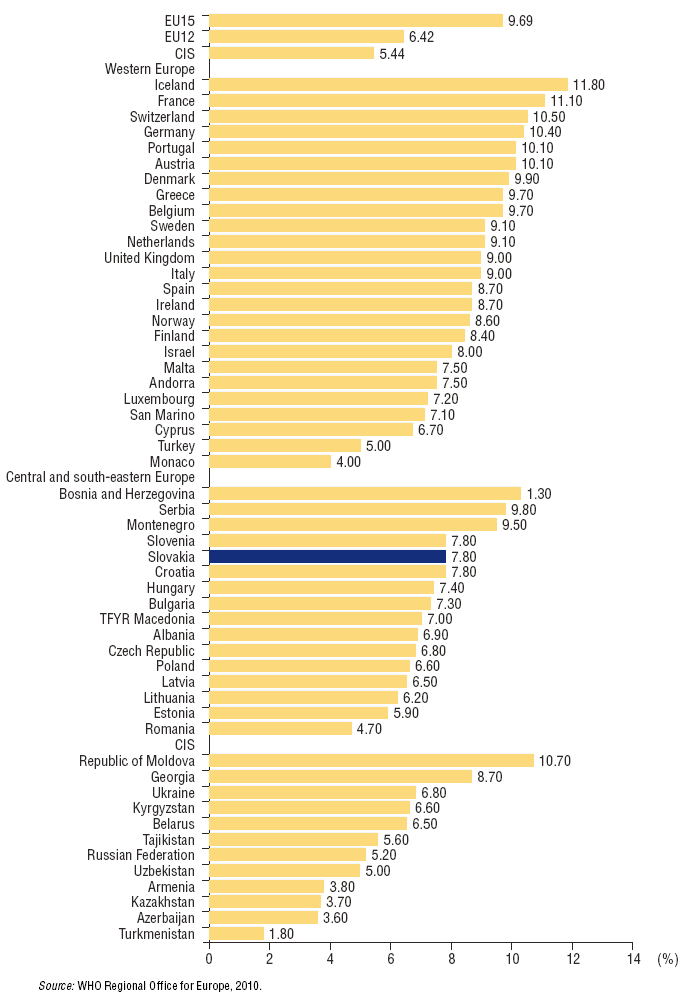
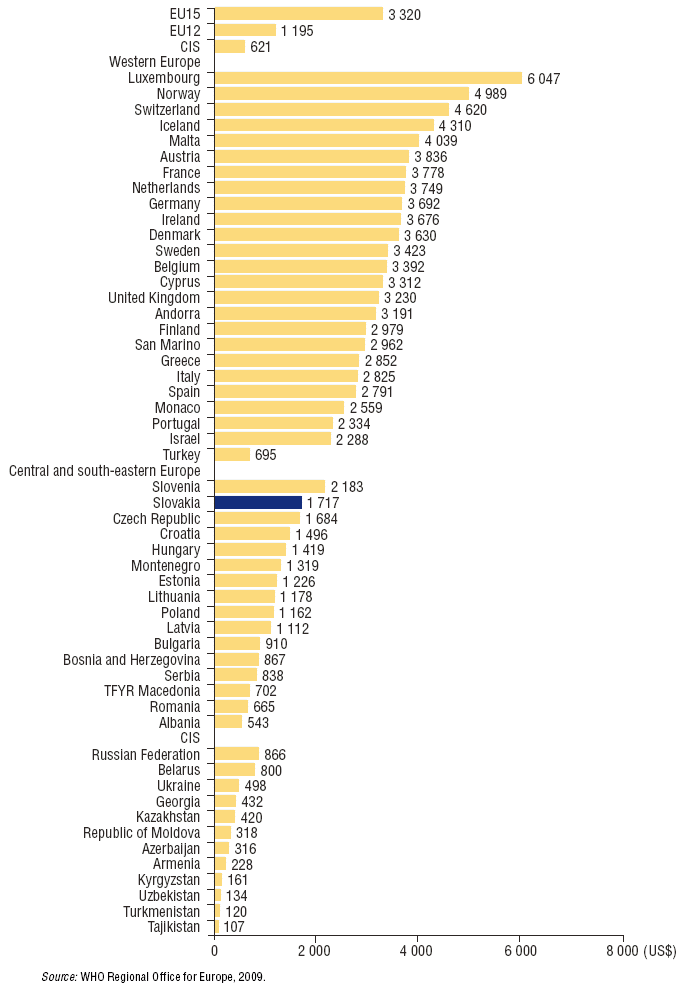
Compared to other European countries, the internationally available figure of 7.8% for Slovak health expenditure as share of GDP in 2008 was well above the EU12 average but still significantly lower than the EU15 average(see Fig. 3.1). This number is higher than in national data, which is due to the internationally accepted National Health Accounts methodology used by the WHO showing higher private expenditure figures than the national sources. Since there is a break in the WHO data series in 2002, the longitudinal data in Fig. 3.2 must be interpreted cautiously. Comparing Slovakia’s per capita expenditure (US$ 1717 in PPP) with the other Visegrád Four countries in 2008 shows that it was slightly higher than in the Czech Republic and much higher than in Hungary and Poland (see Fig. 3.3).
Fig. 3.2: Trends in health expenditure as share (%) of GDP (WHO estimates) in Slovakia and selected countries and averages, 1990 to latest available year
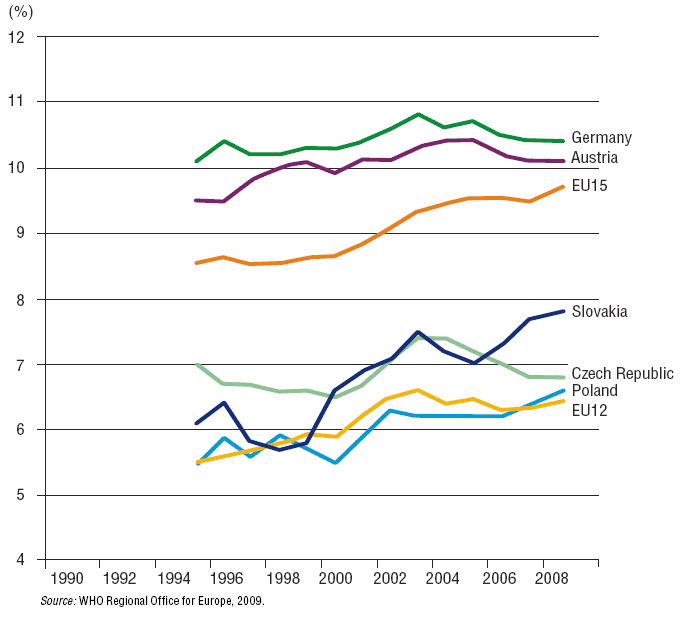
Fig. 3.3: Total health expenditure in US$ PPP per capita in the WHO European Region, 2008 (WHO estimates)
The share of public expenditure on total health expenditure has been decreasing during the economic transformation and fell to 76.5% in 2007 (see Table 3.2). This decrease in public health expenditure is similar to that in the other Visegrád Four countries and is the result of less state interference in all economic sectors, including health care.
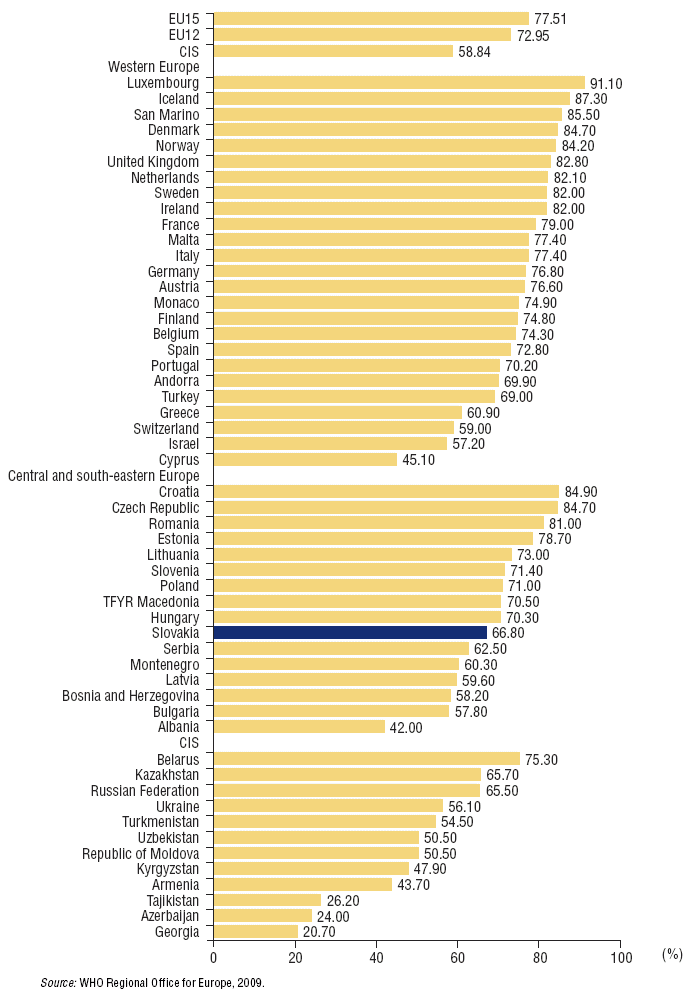
From an international perspective, using WHO data collected according to the National Health Accounts methodology, this number (in 2008) was around 10 percentage points lower. At 66.8% it was among the lowest of all EU countries, slightly below the other Visegrád Four countries, and well below the EU12 and EU15 averages (see Fig. 3.4).
Table 3.2: Trends in health expenditure
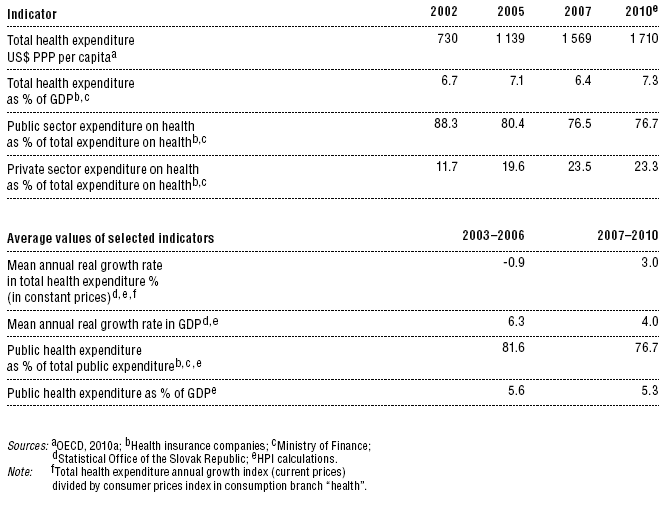
Fig. 3.4: Public sector health expenditures as share (%) of total health expenditure, 2008 (WHO estimates)
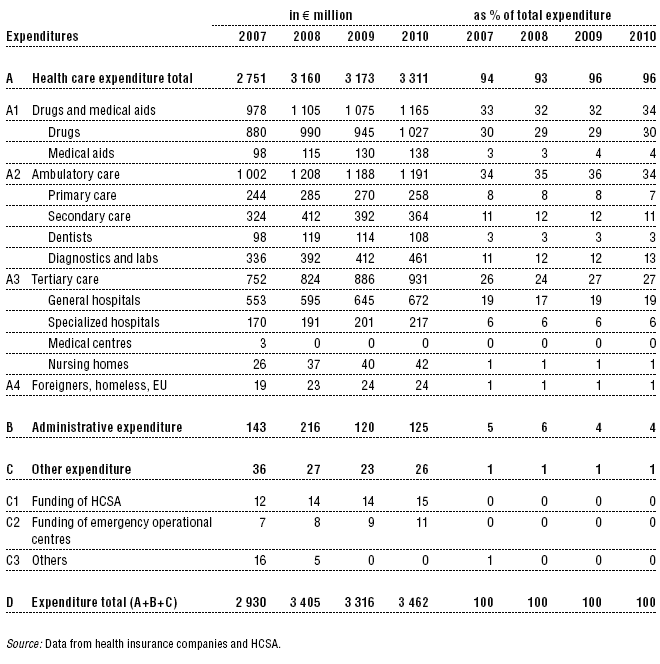
Slovak health insurance companies spend a relatively high share of their revenue on pharmaceuticals. Pharmaceutical expenditure amounts to 30% of expenditures by health insurance companies (Table 3.3) – compared to 7% on primary care, 11% on ambulatory secondary care and 27% on inpatient (“tertiary”) care.
Table 3.3: Health care expenditure by insurance companies
News
The amendment of the Decree on emergency medical service
Health insurance companies returned over 400 thousand €
The HCSA received 1,647 complaints last year
A half million people will earn more
Most of public limited companies ended in the black
Debt of hospitals on premiums has grown to nearly € 105 MM
Slovak health care may miss € 250 million next year
Profits of HIC amounted to € 69 mil. last year
Owners of Dôvera paid out money but did not paid taxes
Like us on Facebook!
Our analyses
- 10 Years of Health Care Reform
- New University Hospital in Bratislava
- Understanding informal patient payments in Kosovo’s healthcare system
- Analysis of waiting times 2013
- Health Policy Basic Frameworks 2014-2016
- Analysis of informal payments in the health sector in Slovakia
- Serbia: Brief health system review
developed by enscope, s.r.o.
