—
1.1 Geography and sociodemography
|
1. Introduction |
Introduction – Organization – Financing – Resources – Provision – Reforms – Assessment – Conclusions – Appendices |
1.2 Economic context |
Slovakia is located in the heart of Europe, with an area of 49 035 km2. Its longest border is with Hungary to the south, with a length of 654.9 km. Slovakia borders Austria to the west (for 107.1 km), Poland to the north (541.1 km), and has its shortest border to the east with the Ukraine for 97.9 km. The border with the Czech Republic in the northwest is 251.8 km long. The Czech Republic used to form one state (Czechoslovakia) together with present-day Slovakia until 1993. The average population density in Slovakia is 110 inhabitants per 1 km2. In 2008, 2.4 million inhabitants lived in provincial municipalities, which is 45% of the total population of 5.4 million (Infostat, 2010). The Slovak Republic became part of the Schengen Area on 21 December 2007. An agreement on a border crossing between the Slovak Republic and the Ukraine with a simplified procedure for residents was signed on 30 May 2008 in Bratislava. Slovakia has been a member of the United Nations and its agencies since 1993, a member of the OECD since 2000, and a member of NATO and the EU since 2004.
The territory of the Slovak Republic (Fig. 1.1) is administratively divided into eight self-governing regions (Bratislava, Trnava, Trenčín, Nitra, Žilina, Banská Bystrica, Košice, Prešov) and 79 districts. In 2008 there were altogether 2891 municipalities, of which 2581 (89%) were provincial municipalities. Of the total population of Slovakia, 85.5% declare their nationality as Slovak. Hungarians, Roma and other nationalities account for 9.7%, 1.6% and 1.8%, respectively (Statistical Office of the Slovak Republic, 2008). With regard to religious affiliation, in 2001, 68.9% of the population of Slovakia were Roman Catholics, 6.9% were members of the Evangelical Church of the Augsburg Confession, 4.1% were Greek Orthodox and 7.1% belonged to other religions; 13% of the population does not have any religious affiliation (Statistical Office of the Slovak Republic, 2002).
Fig. 1.1: Map of Slovakia
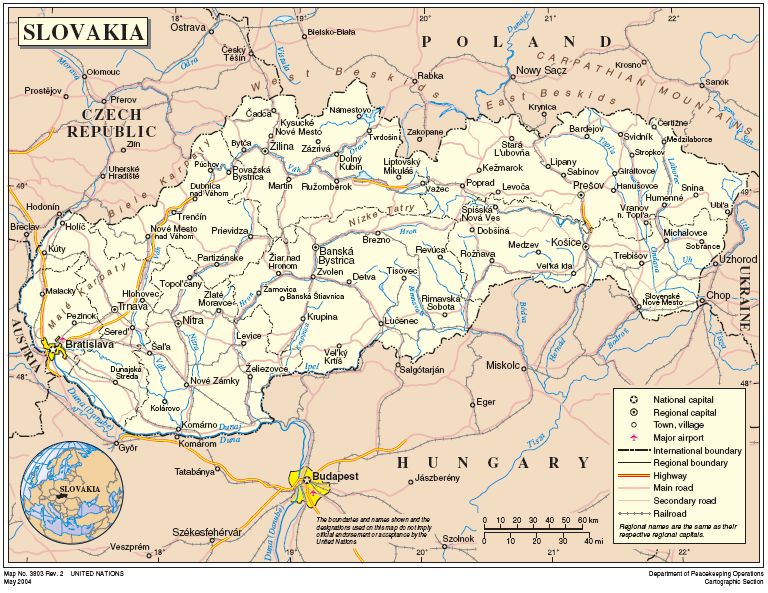
Source: United Nations Cartographic Section, 2004.
The population of Slovakia in 2008 was 5.4 million, women making up 51.4% of that number. Compared to 1993, the population had increased by 75 799 (1.4%) (Table 1.1). A significant decrease of population in the late 1990s was observed due to a decrease in live births, while the mortality rate has dropped at a slower rate. In 2000, natural population growth had decreased to one-tenth of its value in 1990. A negative trend in natural population growth was observed between 2001 and 2003. It has since returned to positive values from 2004 onwards; but, with a decreasing tendency (population growth was 4 196 in 2008).
Between 1993 and 1995, as a result of changes in the social environment, the fertility rate decreased by 21.2%. It fell to 1.32 live births per 1 000 women of reproductive age in 2007, placing Slovakia among the countries with the lowest fertility rate in Europe. This fact is associated with the shift in the average age of women at delivery, which was 28.3 years in 2008. This has increased by 2.65 years since the late 1970s. The average age of women giving birth to their first child has increased by 3.73 years, and was 26.42 in 2008 (Infostat, 2010). Two factors have influenced the higher age of women giving birth to their first child: (1) a changing socioeconomic environment as a result of the transformation of society (the break-up of existing economic relations, general deterioration of the economic situation, decline of social security, and so on) as well as (2) cultural– psychological factors resulting from, for example, changing attitudes towards family planning. According to the 1997 survey (FOCUS, 1997), more than 70% of women with a university degree in 1995 were inclined to postpone having children and considered the age of 24 the optimal age for having children. Population migration has been influenced by two historical milestones. First, the peaceful split of Czechoslovakia into Slovakia and the Czech Republic in 1993 induced higher migration between its successor states. Second, the accession of Slovakia to the EU in 2004 gave citizens of other Member States easier access to permanent residency in Slovakia. Until 2006, migration predominantly took place between the Czech Republic and Slovakia. Since EU enlargement in 2007, the largest number of legal immigrants comes from Romania (20% in 2008), followed by the Czech Republic (13%), Hungary and Germany (both 9%). According to official statistics, Slovakia has positive net migration, which peaked in 2008 (+7060). However, this indicator is unreliable because of the under-reporting of permanent emigrants (an estimated 10% of emigrants are reported). For example, the statistical offices of both Slovakia and the Czech Republic report positive net migration between their countries. Yet, combining immigration data on Slovak emigrants from target countries suggests that Slovakia has negative net migration (Divinský, 2005, 2009).
In 2008, the population percentages of people in pre-productive age (0–14 years) and post-productive age (65+ years) were 15.4% and 12.1%, respectively (see Table 1.1). Looking at the Slovak population pyramid for 1993 and 2009 (see Fig. 1.2), two facts become apparent: the ageing of the population and its irregular age structure. The irregular age structure results from past demographic developments. Population growth after the Second World War (first surge) and favourable social policy during the communist period in 1975–1985 (second surge) combined with a relatively stable mortality level led to disparities in the birth rate over the years. In 2008, 50 000 children were born annually as compared to 100 000 children born annually in the 1970s (Hanus & Daniška, 2008). The population pyramid of Slovakia is contracting, but to a lesser degree than the population pyramids of western and northern European countries. This means that the number of people of post-productive age has been increasing significantly, while at the same time the number of people of pre-productive age has been continuously decreasing. In the long term Slovakia will follow the even stronger contracting trends observed in western Europe.
Fig. 1.2: Population pyramid of Slovakia, 1993 and 2009

Source: Health Policy Institute (HPI) based on Infostat data, 2009.
The economic dependence index was at its lowest value in the modern history of Slovakia in 2008. There were 100 people of productive age for every 38 people of non-productive age. The number of people of pre-productive age, who will form the future economic base of Slovakia, has significantly decreased (from 24.1% in 1993 to 15.4% in 2008). By 2050, the age structure will have changed significantly according to the middle variant of a demographic prognosis by Infostat (2002). Whereas in 2002 there were two people aged 17 for each person aged 65+, in 2050 the proportion will be almost the opposite as there will be almost two people aged 65+ for each person aged 17 years.
Table 1.1: Demographic indicators