—
HPI Network > HPI - Health Policy Institute > Health System in Slovakia > 7. Assessment of the health system > 7.2 Equity
7.2 Equity
Friday, 06. May 2011, 20:28 — HPI
| << PREVIOUS
7.1 Stated objectives of the health care system |
Introduction – Organization – Financing – Resources – Provision – Reforms – Assessment – Conclusions – Appendices |
NEXT >>
7.3 Efficiency of resource allocation |
On the level of financing, it is not only the volume of resources generated that is important but also the distribution of the financial burden. Vertical equity refers to the idea that people with a greater ability to pay should pay more than people with a lower ability to pay. To measure the distribution of the financial burden on population groups, the Kakwani index is used. If the index is positive, the health system is progressive, that is, people with higher incomes pay a higher share. If the index is negative, the system is regressive. If the index is zero, the financing system is proportional and health care contributions reflect the proportion of revenue distribution.
Due to the 2004 health reform, the Kakwani index dropped • slightly, from 0.074 (2002) to 0.045 (2005) (see Table 7.1). Although the progressivity of direct taxes and SHI has increased, at the same time the regressivity of indirect taxes and direct payments has increased:
-
The increase in regressivity of indirect taxes is a consequence of a unification of VAT rates. In 2002, there were two rates, 10% and 23%; in 2003, as an intermediate step, they were set at 14% and 20%; finally, a unified 19% rate was adopted in 2004.
-
The increase in regressivity of out-of-pocket payments was due to the introduction of user fees in 2003 and higher co-payments for drugs, which have affected the poor more than the wealthy. The effect on the overall Kakwani index was also increased due to the larger role assigned to user fees and co-payments in the years after the reform (that is, from 14% in 2003 to 22% in 2006).
-
The increase of progressivity of direct taxes after the introduction of a 19% flat income tax seems to be a paradox. The answer lies in the design of the flat tax. There are many deductible items, which are not subjected to taxation. In addition, the system has “negative tax” components in the form of child bonuses. This means that more than 50% of tax payers do not pay income tax and that the financial burden has been shifted to the wealthy people. However, the progressive effect of direct taxes on the overall Kakwani index was weakened because direct taxes played a lesser role after the reform (8% instead of 12%).
-
A moderate increase in progressivity of SHI contributions was a result of changes in the contributions system. There was an increase in the minimum assessment base and the introduction of a flexible upper assessment base, that is, one that is related to wages instead of a fixed upper ceiling. In addition, annual settlement of contributions was introduced to address under- and over-payment.
Table 7.1: Health system financing sources and their Kakwani indices
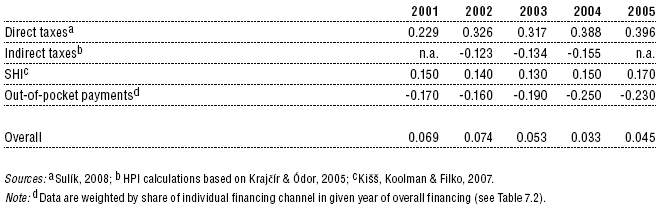
Summing this all up, indirect taxes and out-of-pocket payments increased regressivity in the period 2002–2005, but this trend was compensated by rising progressivity of direct taxes and SHI contributions in the same period. Table 7.2 provides the individual shares of these financing components.
Table 7.2: Share of individual financing channels (%)

Vertical equity determines whether individual contributions to the health sector are proportional to people’s incomes in the real economy. Based on empirical observations, different channels of financing have different rates of progressivity. According to international observations (Wagstaff & van Doorslaer, 1998), direct taxes are the most progressive, while direct payments are the most regressive.
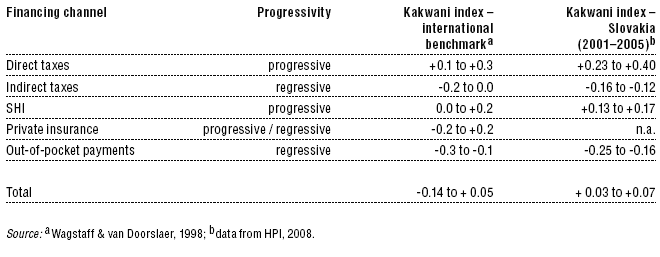
According to the Kakwani index calculated for Slovakia, the country has a progressive system of financing health care. When comparing the international data with the progressivity rate measured for Slovakia (see Table 7.3), the following can be observed:
-
The progressivity of direct taxes exceeds the international • average, mainly after the implementation of a flat tax.
-
Indirect taxes rank in the upper half of the international regressivity range.
-
SHI ranks in the upper quartile of the international progressivity span.
-
There is no private insurance in Slovakia.
-
Direct payments rank in the middle of the international regressivity interval.
Table 7.3: The Kakwani index analysis of Slovakia compared with international data
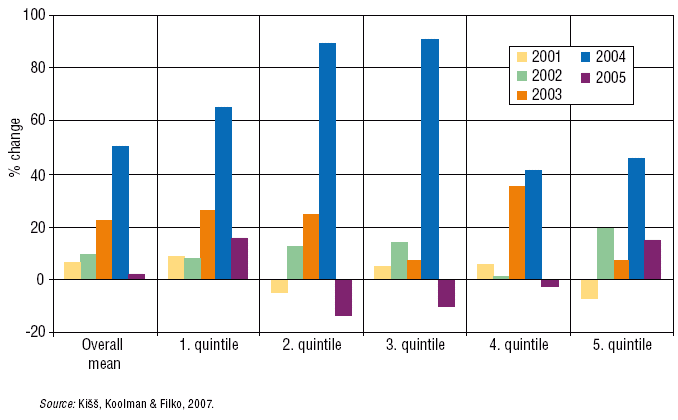
Progressivity alone does not necessarily capture all distribution effects. Measuring catastrophic expenditure of households is therefore another equity criterion. Due to the health reforms in the years 2002–2006, the number of households that contributed more from their income to health care has grown, with strong and statistically significant changes occurring in 2004 (see Figs 7.1 and 7.2). The percentage of people that spent more than 5% of their income on health care increased from 7.3% in 2003 to 16.1% in 2004; the number of people that spent more than 10% of their household income on health care increased from 1% to 4.5% (Fig. 7.1). Until 2004, no household spent more than 20% of their household income on health care. In 2004, there was a significant increase to 1.1% of people. The distributive impacts of the reforms were not equitable. The highest increase was reported for the people in the second and third income quintiles (Fig. 7.2). The cause of this increase was not the user fees introduced in 2003 but the introduction of reference pricing for pharmaceuticals, which significantly increased co-payments for (partly) reimbursed drugs (Kišš, Koolman & Filko, 2007).
Fig. 7.1: Catastrophic financing impact of the 2002–2006 reform: percentage of people (y-axis) spending more than 20%, 15%, 10% and 5% of income (x-axis) in the period 2000–2005
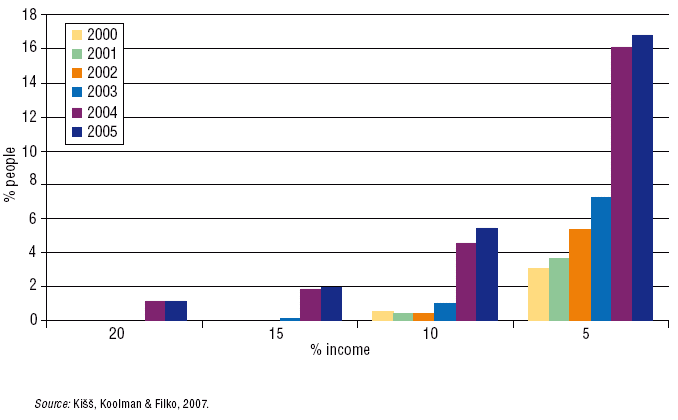
Fig. 7.2: Distributive impact of the 2002–2006 reform: annual change in health spending (%) for different income quintiles
News
The amendment of the Decree on emergency medical service
Health insurance companies returned over 400 thousand €
The HCSA received 1,647 complaints last year
A half million people will earn more
Most of public limited companies ended in the black
Debt of hospitals on premiums has grown to nearly € 105 MM
Slovak health care may miss € 250 million next year
Profits of HIC amounted to € 69 mil. last year
Owners of Dôvera paid out money but did not paid taxes
Like us on Facebook!
Our analyses
- 10 Years of Health Care Reform
- New University Hospital in Bratislava
- Understanding informal patient payments in Kosovo’s healthcare system
- Analysis of waiting times 2013
- Health Policy Basic Frameworks 2014-2016
- Analysis of informal payments in the health sector in Slovakia
- Serbia: Brief health system review
developed by enscope, s.r.o.
